

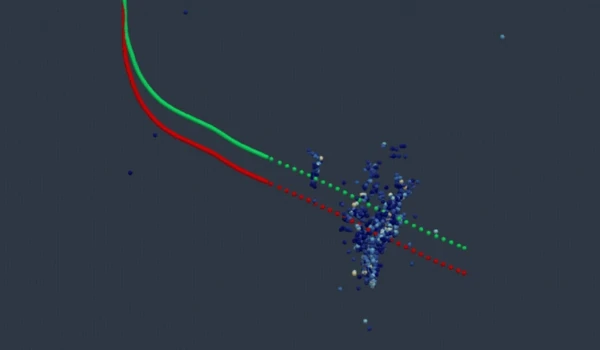
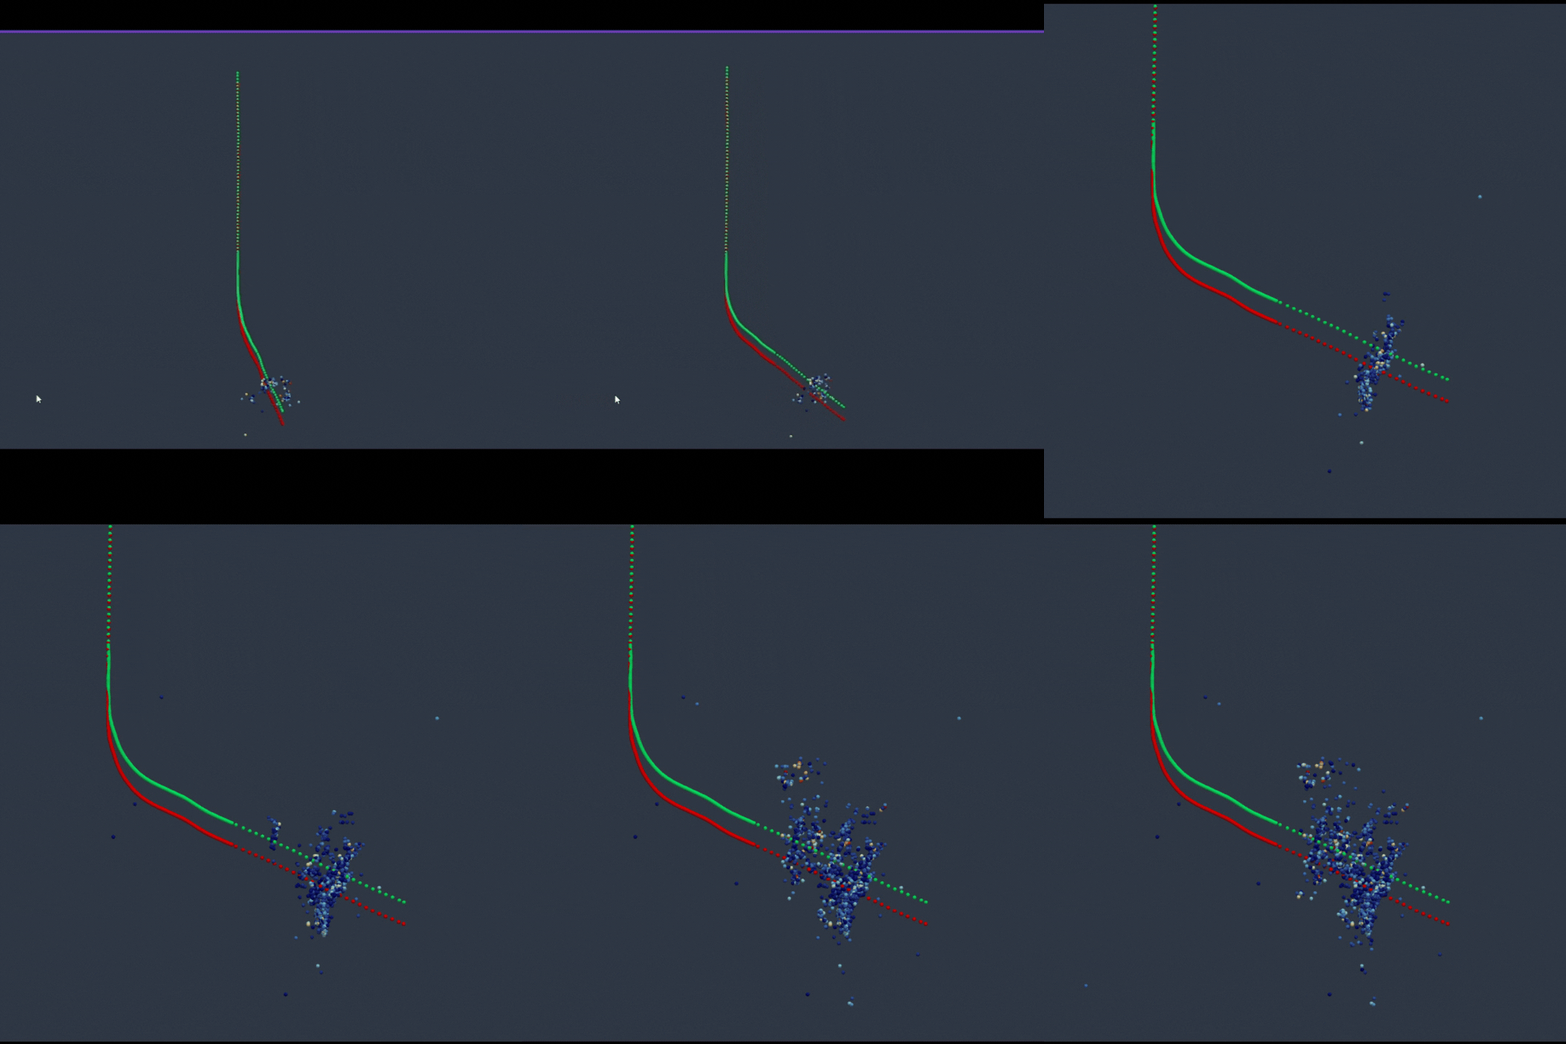
The Utah FORGE (Frontier Observatory for Research in Geothermal Energy) project is a large-scale underground laboratory funded by the U.S. Department of Energy (DOE). It is located near Milford, Utah, on the western flank of the Mineral Mountains.
The main objective of the project is to develop, test, and optimize technologies related to Enhanced Geothermal Systems (EGS) in order to make geothermal energy exploitation reproducible and commercially viable wherever the Earth’s crustal heat is accessible, but the natural rock is impermeable.
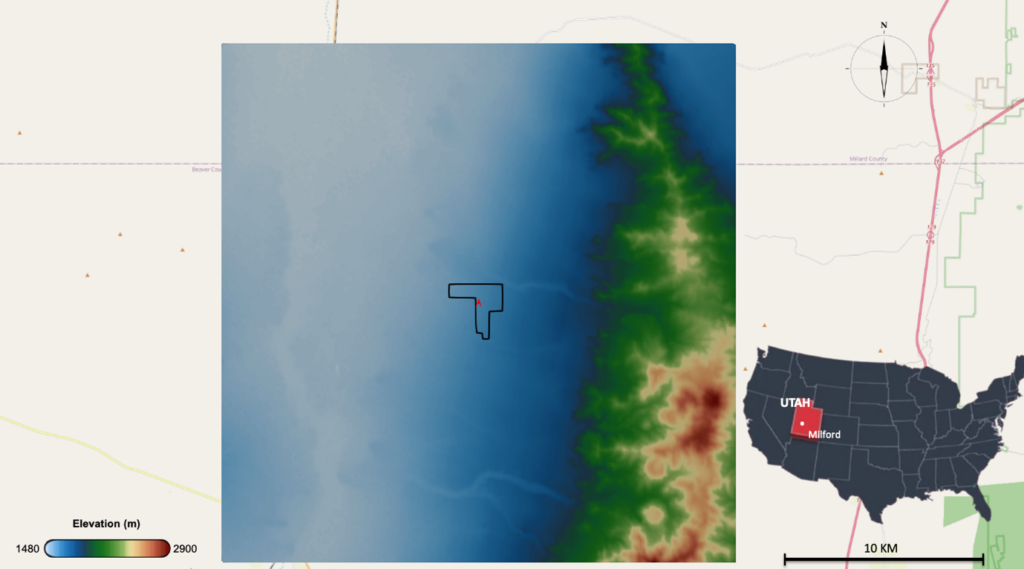
2D view and topography of the Utah FORGE site (Milford, Utah, USA). The black outline delimits the study area. The high-altitude zone to the east corresponds to the Mineral Mountains, whose western flank hosts the hot granite pluton targeted by the project.
The site rests on a hot, granitic crystalline basement rock. The target reservoir is located at a depth of about 2 to 3 km, with temperatures reaching 175 °C to 227 °C. The host rock has extremely low natural permeability and porosity. To circulate water through it and extract heat, the project involves artificially fracturing the rock in a controlled manner to create an artificial underground heat exchanger between injection and production wells.
Key Project Phases
The FORGE project has historically been structured into three major administrative and operational phases.
- Phase 1 (2014–2016) focused on site selection. Five candidates across the United States were evaluated based on initial conceptual geological modeling.
- Phase 2 (2016–2018) involved setting up complete surface instrumentation (seismic networks, GPS, etc.) and drilling pilot characterization wells, such as well 58-32.
- Phase 3 (2018–Present) is the ongoing operational phase. Several deep deviated wells have been drilled, notably the 16A(78)-32 injection well and monitoring wells. Stepwise hydraulic stimulation campaigns were conducted to connect the wells via a network of fractures, and large-scale circulation tests were also performed. Additionally, other cutting-edge third-party technologies are being tested on-site, including high-temperature drilling, DAS fiber-optic logging, and seismic imaging.
Direct downhole measurements confirmed the site’s exceptional geothermal gradient, from surface to −2,500 m
Collected Data
A massive amount of multidisciplinary data is continuously collected and archived in the Geothermal Data Repository (GDR):
- Geological and lithological data: drill cores, cuttings, and well logs (revealing a basement composed mainly of granite, quartz monzonite, orthogneiss, and enclosed metamorphic rocks)
- Seismicity and microseismicity data: continuous recordings by the regional seismological network (UUSS) and dense local networks of seismometers and downhole sensors (geophones, accelerometers, and surface stations)
- Deformation and geodetic data (GPS / InSAR): measurements of surface movements via a network of GPS monuments distributed across the site
- Hydrological and geochemical data: analyses of the chemical composition of peripheral groundwater and monitoring of piezometric levels
- Geophysical data: magnetotelluric (MT) imaging to map resistivity and fault structure, as well as 4D microgravity surveys
Operational stimulation and circulation data: wellhead pressures, injection rates, temperatures, and high-resolution fiber-optic signals (DAS)
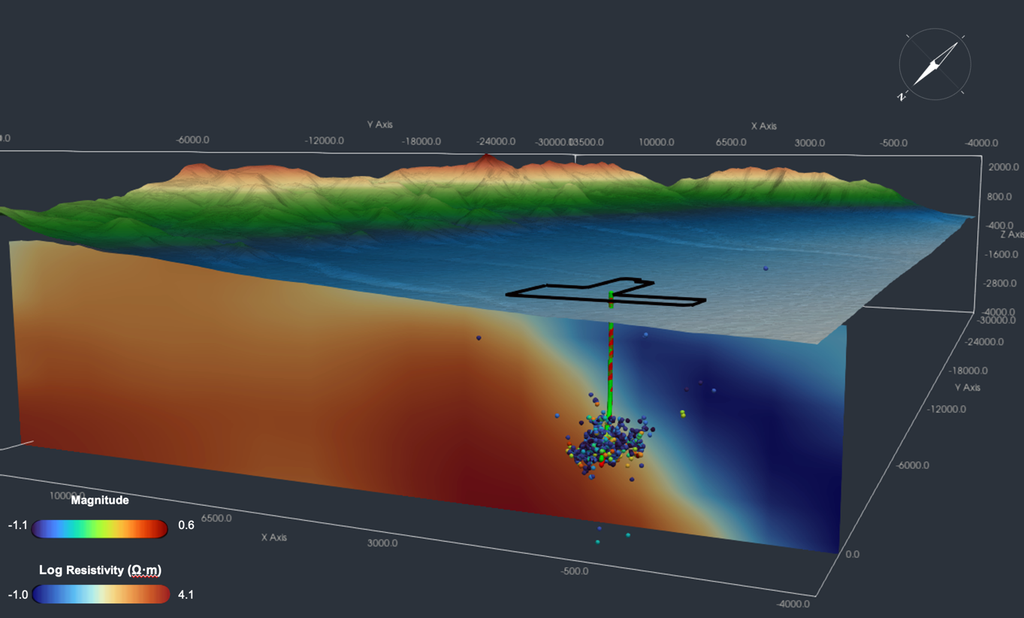
3D visualization combining magnetotelluric resistivity, well trajectories, and microseismicity. Microseismic events cluster precisely at the interface between the resistive zone (dry granite) and the conductive zone (fluid-saturated fractures)
Interpreting Data
Cross-analysis of these data by scientists has made it possible to interpret and better know the subsurface structure and behavior of the area.
The local tectonic stress regime is of the normal-faulting type, with a maximum horizontal stress-oriented NNE-SSW. This parameter is critical for predicting the direction of fracture opening during water injections.
Circulation tests (achieving significant flow rates on the order of 10 bpm at depths of 2–3 km) have demonstrated that it is possible to create efficient and durable hydraulic connectivity between highly deviated wells spaced hundreds of vertical feet apart by combining natural and induced fractures.
The combined analysis of micro-seismic data and fiber optics (DAS) makes it possible to map the three-dimensional growth of fracture networks in real-time while controlling operational seismic risks.
Final reports and coupled models (THMC: Thermal, Hydrological, Mechanical, Chemical) confirm that the reservoir responds predictably to injected cold fluid flows, validating the site’s potential as a reproducible model for global EGS development.
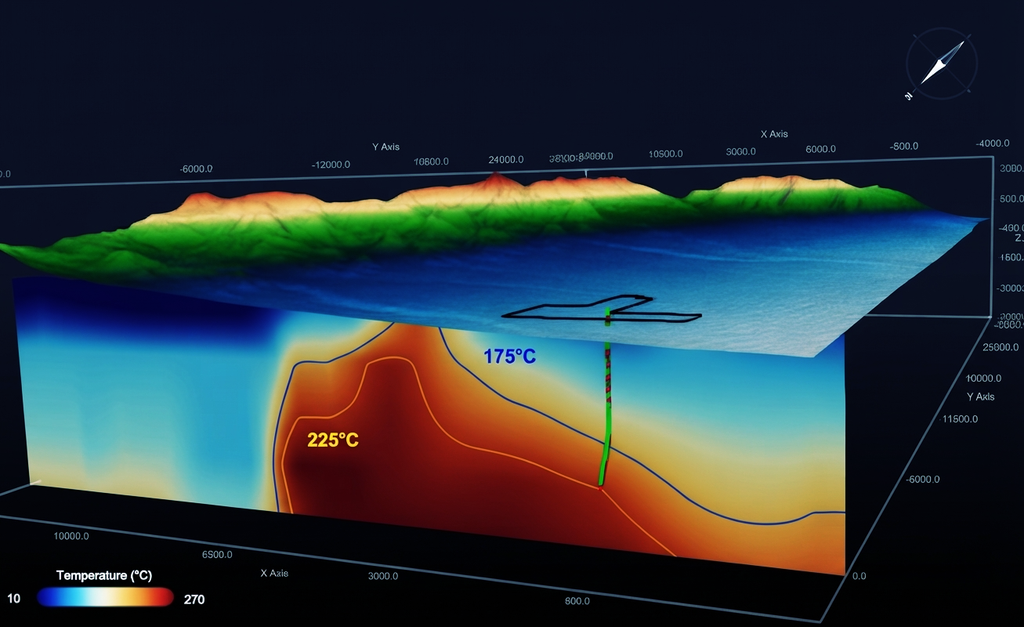
Spatial correlation between temperature profiles and microseismicity between wells 16A and 16B
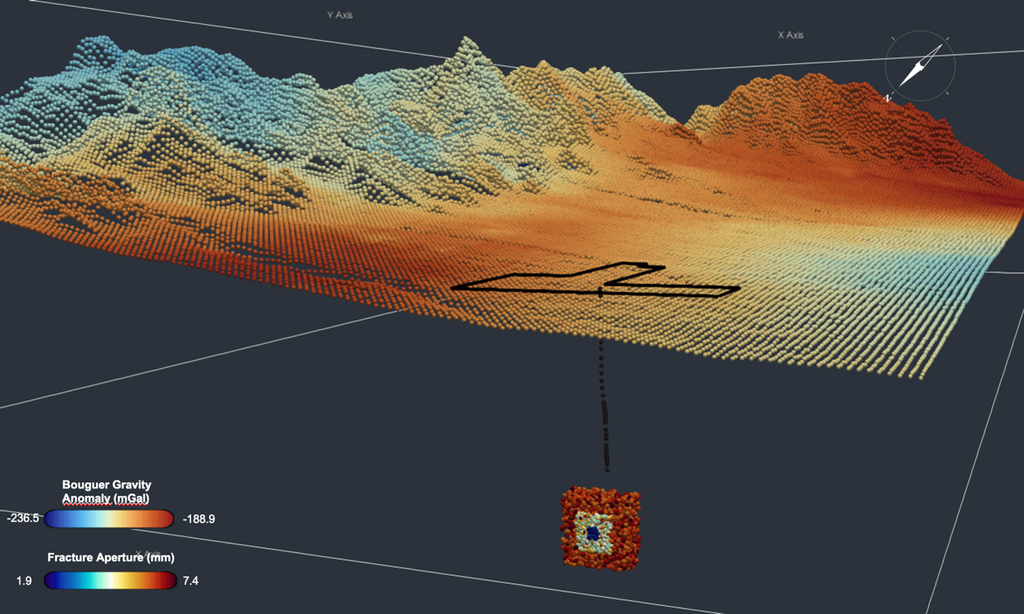
The Discrete Fracture Network (DFN) is a 3D numerical model of the natural fracture network of the reservoir. It was built from FMI (Formation Micro Imager) data acquired in pilot well 58-32: by imaging the borehole wall over 360°, this tool identified each natural fracture with its orientation, dip, and density. From these real measurements, fractures were then statistically extrapolated across the entire reservoir volume.
Combining gravity data and the Discrete Fracture Network (DFN) model provided a precise map of the subsurface: where the most open fractures are located, their orientations, and their connectivity at depth. This integrated approach guided the exact trajectory and angling of wells 16A and 16B.
Outlook
Utah FORGE is planning an extended circulation test designed to observe the long-term behavior of the reservoir: thermal drawdown, fluid losses, and risks of scaling and corrosion. These data are essential for sizing future commercial EGS projects capable of producing reliably over several decades.
The drilling of a third deep deviated well is also under consideration. It would explore alternative reservoir geometries and optimize well configurations to improve commercial performance. With U.S. Department of Energy (DOE) funding secured through 2028, Utah FORGE is entering a new phase whose results will directly help define the standards for the next generation of EGS systems worldwide.
The technically recoverable EGS potential in the United States alone exceeds 5 terawatts, which is five times the country’s current electricity capacity. Utah FORGE does not yet produce electricity, but if this type of approach can be replicated in other geological contexts, it represents a concrete source of hope for the global energy transition.
Explore FORGE Data for free via EarthSight™
By downloading the free pilot version of EarthSight™ software (version 0.2.0), a FORGE demo project is automatically installed. You can display the wells trajectories, temperature profiles, microseismicity, and magnetotelluric resistivity in 3D. Up Squad is the user community of Look Up Geoscience, users share their needs and build the roadmap of the software.
Join Up Squad and download EarthSight™ pilot version for free
All data generated by the Utah FORGE site are publicly available via the Department of Energy’s Geothermal Data Repository (GDR). Look Up Geoscience thanks Utah FORGE for sharing their data. All visualizations in this article were rendered using EarthSight™ software.
Hugo Bonnet and Fabien Cubizolle
References
Cariaga, C. (2026). Carrying on the legacy of geothermal innovation at the Utah FORGE project. ThinkGeoEnergy.
Heidbach, O. et al. (2018). The World Stress Map Database Release 2016: Crustal stress pattern across scales. Tectonophysics, 744, 484–498.
Moore, J. et al. (2024). Geology of the Utah FORGE EGS Site. Journal of Volcanology and Geothermal Research, 449, 107850.
Norbeck, J. et al. (2024). Hydraulic stimulation and circulation testing at the Utah FORGE Enhanced Geothermal Systems field laboratory. Geothermics.
U.S. Geological Survey (2008). A review of methods applied by the U.S. Geological Survey in the assessment of identified geothermal resources. USGS Open-File Report 2008-1296.
Utah FORGE (2024). Utah FORGE Successfully Completes Stimulation and Circulation Tests. Press Release.